Mutual Funds
Aditya Birla SL Nifty Next 50 ETF
Equity  |   Very High  |   ETFs - Index
74.72   +1.24
NAV(₹) as on 4/11/2026
1.69%
  1D
1.81%
  1Y
17.32%
  3Y
11.42%
  5Y
Aditya Birla SL Nifty Next 50 ETF
Growth Chart of the Scheme

Scheme Details
Expense Ratio:
0.16
Launch Date:
18 Dec 2018
Exit Load:
AUM:
₹ 52.61 Crs
Lock-in:
Nil
Investing Style:
Large Growth
Portfolio Price To Book Value:
8.00
Min. Investment:
SIP : ₹ NA
Lumpsum : ₹ 5,000.00
Scheme Benchmark:
NA
Fund Manager:
Mehul Dama ,Priya Sridhar

FUND OBJECTIVE

The investment objective of the scheme is to provide returns that closely correspond to the totalreturns of securities as represented by Nifty Next 50, subject to tracking errors. The Scheme doesnot guarantee/indicate any returns. There can be no assurance that the schemes’ objectiveswill be achieved.

LATEST ASSET & PORTFOLIO ALLOCATION Others Equity
as on 30/9/2026 0.02 % 99.98 %
TOP HOLDINGS

Divi's Laboratories Ltd.
4.84 %

TVS Motor Company Ltd.
3.95 %

Hindustan Aeronautics Ltd.
3.63 %

Tata Motors Ltd.
3.61 %

Adani Power Ltd.
3.48 %

Samvardhana Motherson International Ltd.
2.95 %

Torrent Pharmaceuticals Ltd.
2.89 %

Cholamandalam Investment and Finance Company Ltd.
2.88 %

Vedanta Aluminium Metal Ltd.
2.87 %

Cummins India Ltd.
2.63 %

See All Holding
ALLOCATION BY MARKET CAP (Equity)
ALLOCATION BY RATING (Debt & Others)

No Data

ALLOCATION BY SECTOR

Power Generation/Distributio
9.45 %

Pharmaceuticals & Drugs
8.91 %

Electric Equipment
7.96 %

Finance - NBFC
6.73 %

Bank - Public
6.34 %

See All Sectors
PORTFOLIO CHARACTERISTICS (Debt)

No Data

5 YEAR HISTORY

Financial Year 2021-22 2022-23 2023-24 2024-25 2025-26
NAV (31/3/2026) 42.00 38.84 62.62 65.58 63.32
Net Assets (Rs Crores) 10,589.36 6,569.70 6,584.90 12,863.99 9,100.30
Scheme Returns(%)(Absolute) 19.63 -8.93 60.84 3.01 -2.41
B'mark Returns(%)(Absolute) NA NA NA NA NA
Category Rank 21/111 141/160 15/201 176/238 191/323
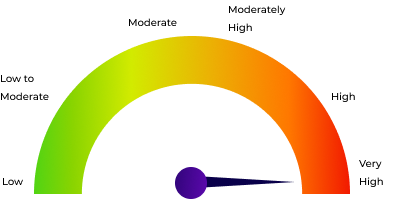
RISKOMETER
Level of Risk in the Scheme

Clients will understand that their principal will be at Very High risk.

PERFORMANCE COMPARISON WITH SIMILAR SCHEMES

Fund Details Inception Date Aum(₹ Crs) 1Y 3Y 5Y Since Inception
MDB Logo
Groww Nifty 500 Low Volatility 50 ETF
ETFs - Index  |   Very High |  10.25   +0.05  
13/6/2025 ₹ 3.81 -2.95% - - 1.79%
MDB Logo
Baroda BNP Paribas NIFTY Bank ETF
ETFs - Index  |   Very High |  56.39   +0.38  
18/6/2024 ₹ 4.07 -2.95% - - 4.79%
MDB Logo
Invesco India BSE Sensex ETF
ETFs - Index  |   Very High |  77.37   +0.38  
20/8/2026 ₹ 4.46 - - - -0.26%
MDB Logo
SBI Nifty200 Value 30 ETF
ETFs - Index  |   Very High |  14.25   +0.22  
20/5/2026 ₹ 5.74 - - - -7.01%
MDB Logo
Motilal Oswal Nifty Services Sector ETF
ETFs - Index  |   Very High |  31.58   +0.02  
24/11/2025 ₹ 5.9 - - - -6.85%
MDB Logo
Motilal Oswal BSE Select IPO ETF
ETFs - Index  |   Very High |  46.15   +0.68  
17/11/2025 ₹ 6.01 - - - -6.22%
MDB Logo
Groww Nifty PSU Bank ETF
ETFs - Index  |   Very High |  83.22   +0.61  
24/3/2026 ₹ 6.01 - - - -0.53%
MDB Logo
Groww Nifty Midcap 150 ETF
ETFs - Index  |   Very High |  219.17   +3.43  
13/11/2025 ₹ 6.04 - - - -1.93%
MDB Logo
Invesco India Nifty Bank ETF
ETFs - Index  |   Very High |  55.87   +0.37  
20/8/2026 ₹ 6.34 - - - -2.75%
MDB Logo
360 ONE MSCI India ETF
ETFs - Index  |   Very High |  9.94   +0.09  
22/5/2026 ₹ 6.48 - - - -0.63%