Mutual Funds
Edelweiss BSE Capital Markets & Insurance ETF
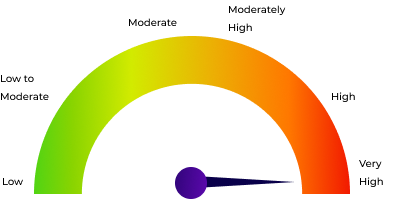
Equity  |   Very High  |   ETFs - Index
23.96   +0.18
NAV(₹) as on 6/11/2026
0.78%
  1D
1.71%
  1Y
   -
  3Y
   -
  5Y
Edelweiss BSE Capital Markets & Insurance ETF
Growth Chart of the Scheme

Scheme Details
Expense Ratio:
0.57
Launch Date:
30 Dec 2024
Exit Load:
AUM:
₹ 14.13 Crs
Lock-in:
Nil
Investing Style:
Large Growth
Portfolio Price To Book Value:
8.97
Min. Investment:
SIP : ₹ NA
Lumpsum : ₹ 5,000.00
Scheme Benchmark:
NA
Fund Manager:
Bhavesh Jain ,Manasi Jalgaonkar

FUND OBJECTIVE

The investment objective of the scheme is to generate returns that are in line with the performance of the BSE Capital Markets & Insurance Total Return Index, subject to tracking errors.

LATEST ASSET & PORTFOLIO ALLOCATION Others Equity
as on 30/9/2026 0.07 % 99.93 %
TOP HOLDINGS

SBI Life Insurance Company Ltd.
10.33 %

Multi Commodity Exchange Of India Ltd.
10.19 %

HDFC Life Insurance Company Ltd.
8.80 %

Life Insurance Corporation of India
8.73 %

HDFC Asset Management Company Ltd.
7.33 %

ICICI Lombard General Insurance Company Ltd.
6.17 %

Max Financial Services Ltd.
5.75 %

360 One Wam Ltd.
4.24 %

Billionbrains Garage Ventures Ltd.
4.22 %

Anand Rathi Wealth Ltd.
3.07 %

See All Holding
ALLOCATION BY MARKET CAP (Equity)
ALLOCATION BY RATING (Debt & Others)

No Data

ALLOCATION BY SECTOR

Insurance
42.62 %

Finance - Asset Management
15.42 %

Finance - Stock Broking
11.33 %

Exchange and Data Platform
10.19 %

Finance - Others
8.82 %

See All Sectors
PORTFOLIO CHARACTERISTICS (Debt)

No Data

5 YEAR HISTORY

Financial Year 2024-25 2025-26
NAV (31/3/2026) 19.16 21.21
Net Assets (Rs Crores) 1,179.43 1,491.35
Scheme Returns(%)(Absolute) -8.71 11.43
B'mark Returns(%)(Absolute) NA NA
Category Rank 14/16 59/323
RISKOMETER
Level of Risk in the Scheme

Clients will understand that their principal will be at Very High risk.

PERFORMANCE COMPARISON WITH SIMILAR SCHEMES

Fund Details Inception Date Aum(₹ Crs) 1Y 3Y 5Y Since Inception
MDB Logo
Groww Nifty 500 Low Volatility 50 ETF
ETFs - Index  |   Very High |  10.46   +0.09  
13/6/2025 ₹ 3.81 -0.77% - - 3.23%
MDB Logo
Baroda BNP Paribas NIFTY Bank ETF
ETFs - Index  |   Very High |  59.59   +1.32  
18/6/2024 ₹ 4.07 3.04% - - 7.23%
MDB Logo
Invesco India BSE Sensex ETF
ETFs - Index  |   Very High |  81.11   +1.74  
20/8/2026 ₹ 4.46 - - - 4.57%
MDB Logo
HDFC FTSE India Equity ETF
ETFs - Index  |   Very High |  32.93   +0.36  
12/10/2026 ₹ 4.88 - - - 8.56%
MDB Logo
Motilal Oswal Nifty Services Sector ETF
ETFs - Index  |   Very High |  32.81   +0.55  
24/11/2025 ₹ 5.9 - - - -3.22%
MDB Logo
Motilal Oswal BSE Select IPO ETF
ETFs - Index  |   Very High |  47.18   +-0.08  
17/11/2025 ₹ 6.01 - - - -4.13%
MDB Logo
Groww Nifty PSU Bank ETF
ETFs - Index  |   Very High |  86.32   +0.51  
24/3/2026 ₹ 6.01 - - - 3.19%
MDB Logo
Groww Nifty Midcap 150 ETF
ETFs - Index  |   Very High |  223.25   +-0.16  
13/11/2025 ₹ 6.04 - - - -0.10%
MDB Logo
Invesco India Nifty Bank ETF
ETFs - Index  |   Very High |  59.04   +1.31  
20/8/2026 ₹ 6.34 - - - 2.76%
MDB Logo
360 ONE MSCI India ETF
ETFs - Index  |   Very High |  10.27   +0.13  
22/5/2026 ₹ 6.48 - - - 2.71%