Mutual Funds
Bharat 22 ETF
Other  |   Very High  |   ETFs - Other
114.53   -1.08
NAV(₹) as on 6/11/2025
-0.94%
  1D
-0.31%
  1Y
26.55%
  3Y
34.46%
  5Y
Bharat 22 ETF
Growth Chart of the Scheme

Scheme Details
Expense Ratio:
0.07
Launch Date:
24 Nov 2017
Exit Load:
Nil
AUM:
₹ 15,456.37 Crs
Lock-in:
Nil
Investing Style:
Large Growth
Portfolio Price To Book Value:
3.67
Min. Investment:
SIP : ₹ NA
Lumpsum : ₹ 5,000.0
Scheme Benchmark:
NA
Fund Manager:
Nishit Patel ,Ajaykumar Solanki ,Ashwini Shinde

FUND OBJECTIVE

The investment objective of the Scheme is to invest in constituents of the underlying Index in the same proportion as in the underlying Index, and endeavor to provide returns before expenses, which closely correspond to the total returns of the underlying Index. However, the performance of the Scheme may differ from that of underlying index due to tracking error. There can be no assurance or guarantee that the investment objective of the Scheme would be achieved.

LATEST ASSET & PORTFOLIO ALLOCATION Others Equity
as on 30/9/2025 0.07 % 99.93 %
TOP HOLDINGS

Larsen & Toubro Ltd.
15.49 %

ITC Ltd.
13.18 %

NTPC Ltd.
9.21 %

State Bank Of India
8.30 %

Axis Bank Ltd.
7.99 %

Power Grid Corporation Of India Ltd.
7.27 %

Bharat Electronics Ltd.
5.84 %

Oil & Natural Gas Corporation Ltd.
5.34 %

Coal India Ltd.
5.09 %

National Aluminium Company Ltd.
5.03 %

See All Holding
ALLOCATION BY MARKET CAP (Equity)
ALLOCATION BY RATING (Debt & Others)

No Data

ALLOCATION BY SECTOR

Power Generation/Distributio
18.90 %

Engineering - Construction
15.49 %

Cigarettes/Tobacco
13.18 %

Bank - Public
10.14 %

Bank - Private
7.99 %

See All Sectors
PORTFOLIO CHARACTERISTICS (Debt)

No Data

5 YEAR HISTORY

Financial Year 2020-21 2021-22 2022-23 2023-24 2024-25
NAV (31/3/2025) 35.97 48.55 58.74 101.03 104.60
Net Assets (Rs Crores) 6,91,558.34 8,61,843.71 10,19,815.86 16,82,935.25 17,93,028.74
Scheme Returns(%)(Absolute) 62.26 32.42 18.15 71.61 2.14
B'mark Returns(%)(Absolute) NA NA NA NA NA
Category Rank 10/17 3/29 4/16 2/9 11/16
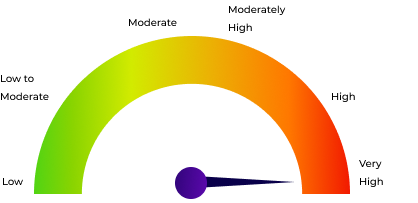
RISKOMETER
Level of Risk in the Scheme

Clients will understand that their principal will be at Very High risk.

PERFORMANCE COMPARISON WITH SIMILAR SCHEMES

Fund Details Inception Date Aum(₹ Crs) 1Y 3Y 5Y Since Inception
MDB Logo
Motilal Oswal NASDAQ Q 50 ETF
ETFs - Other  |   Very High |  84.94   +-2.28  
23/12/2021 ₹ 110.19 28.64% 19.63% - 7.06%
MDB Logo
Nippon India ETF Hang Seng BeES
ETFs - Other  |   Very High |  440.72   +8.74  
15/3/2010 ₹ 1,055.26 38.63% 24.51% 6.82% 8.43%
MDB Logo
Mirae Asset Hang Seng TECH ETF
ETFs - Other  |   Very High |  22.69   +0.47  
7/12/2021 ₹ 478.81 37.04% 25.68% - 4.38%
MDB Logo
Bharat 22 ETF
ETFs - Other  |   Very High |  114.53   +-1.08  
24/11/2017 ₹ 15,456.37 -0.31% 26.55% 34.46% 15.67%
MDB Logo
Mirae Asset S&P 500 Top 50 ETF
ETFs - Other  |   Very High |  58.89   +-0.92  
21/9/2021 ₹ 965.95 32.16% 32.67% - 20.37%
MDB Logo
CPSE ETF
ETFs - Other  |   Very High |  91.59   +-1.43  
28/3/2014 ₹ 32,226.16 -2.46% 33.30% 39.97% 15.34%
MDB Logo
Motilal Oswal Nasdaq 100 ETF
ETFs - Other  |   Very High |  220.14   +-4.82  
30/3/2011 ₹ 10,804.08 34.30% 36.44% 21.82% 23.29%
MDB Logo
Mirae Asset NYSE FANG+ ETF
ETFs - Other  |   Very High |  145.04   +-3.24  
7/5/2021 ₹ 3,491.94 49.31% 60.85% - 27.40%