Mutual Funds
Mahindra Manulife Asia Pacific REITs FOF-Reg(G)
Other  |   Very High  |   FoFs (Overseas)
10.31   +0.10
NAV(₹) as on 4/11/2026
0.97%
  1D
2.95%
  1Y
9.32%
  3Y
0.76%
  5Y
Mahindra Manulife Asia Pacific REITs FOF-Reg(G)
Growth Chart of the Scheme

Scheme Details
Expense Ratio:
1.38
Launch Date:
20 Oct 2021
Exit Load:
Nil upto 10% of units and 1% for remaining units on or before 12M, Nil after 12M
AUM:
₹ 39.58 Crs
Lock-in:
Nil
Investing Style:
NA
Portfolio Price To Book Value:
NA
Min. Investment:
SIP : ₹ NA
Lumpsum : ₹ 5,000.00
Scheme Benchmark:
FTSE EPRA Nareit Asia ex Japan REITs Index
Fund Manager:
Krishna Sanghavi ,Amit Garg

FUND OBJECTIVE

provide long term capital appreciation by investing predominantly in units of Manulife Global Fund -Asia Pacific REIT Fund, an overseas fund primarily investing in real estate investment trusts (REITs)in the Asia Pacific ex-Japan region. However, there can be no assurance that the investment objectiveof the Scheme will be achieved.

LATEST ASSET & PORTFOLIO ALLOCATION Others
as on 30/9/2026 100.00 %
TOP HOLDINGS

Manulife Global Fund SICAV-Asia Pacific REIT
98.93 %

Tri-Party Repo (TREPS)
1.18 %

Clearing Corporation Of India Ltd.
0.05 %

Net Current Asset
-0.16 %

See All Holding
ALLOCATION BY MARKET CAP (Equity)
ALLOCATION BY RATING (Debt & Others)
ALLOCATION BY SECTOR

No Data

PORTFOLIO CHARACTERISTICS (Debt)

No Data

5 YEAR HISTORY

Financial Year 2021-22 2022-23 2023-24 2024-25 2025-26
NAV (31/3/2026) 9.54 8.88 8.12 8.42 10.22
Net Assets (Rs Crores) 3,818.64 3,131.37 2,273.42 2,382.33 4,151.40
Scheme Returns(%)(Absolute) -4.63 -7.30 -9.92 3.72 21.01
B'mark Returns(%)(Absolute) NA NA NA NA NA
Category Rank 37/51 41/54 56/59 39/58 39/58
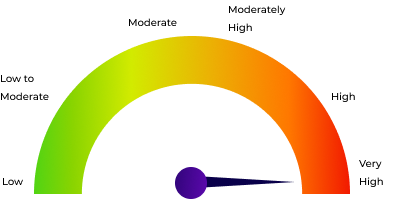
RISKOMETER
Level of Risk in the Scheme

Clients will understand that their principal will be at Very High risk.

PERFORMANCE COMPARISON WITH SIMILAR SCHEMES

Fund Details Inception Date Aum(₹ Crs) 1Y 3Y 5Y Since Inception
MDB Logo
Axis US Specific Treasury Dynamic Debt Passive FoF-Reg(G)
FoFs (Overseas)  |   Very High |  12.08   +0.03  
22/12/2023 ₹ 36.47 5.42% - - 6.79%
MDB Logo
DSP US Specific Debt Passive FoF-Reg(G)
FoFs (Overseas)  |   Very High |  12.35   +0.02  
18/3/2024 ₹ 52.1 5.68% - - 8.34%
MDB Logo
Kotak Quality Overseas Equity Active FOF-Reg(G)
FoFs (Overseas)  |   Very High |  11.81   +0.31  
25/3/2026 ₹ 404.36 - - - 18.08%
MDB Logo
Aditya Birla SL US Treasury 3-10 Year Bond ETFs Passive FOF-Reg(G)
FoFs (Overseas)  |   Very High |  12.88   +0.01  
31/10/2023 ₹ 130.3 6.31% 8.25% - 8.75%
MDB Logo
HSBC Brazil Fund(G)
FoFs (Overseas)  |   Very High |  9.02   +0.12  
9/5/2011 ₹ 352.83 6.24% 8.40% 8.47% -0.66%
MDB Logo
Aditya Birla SL US Treasury 1-3 Year Bonds ETFs Passive FOF-Reg(G)
FoFs (Overseas)  |   Very High |  12.82   +-0.01  
31/10/2023 ₹ 65.59 9.06% 8.48% - 8.58%
MDB Logo
Bandhan US Treasury Bond 0-1 year specific Debt Passive FOF-Reg(G)
FoFs (Overseas)  |   Very High |  13.39   +-0.01  
28/3/2023 ₹ 143.31 10.69% 8.81% - 8.42%
MDB Logo
Mahindra Manulife Asia Pacific REITs FOF-Reg(G)
FoFs (Overseas)  |   Very High |  10.31   +0.10  
20/10/2021 ₹ 39.58 2.95% 9.32% 0.76% 0.61%
MDB Logo
Kotak International REIT Overseas Equity Active FOF-Reg(G)
FoFs (Overseas)  |   Very High |  11.31   +0.19  
29/12/2020 ₹ 98.9 0.61% 10.06% 1.86% 2.13%
MDB Logo
PGIM India Global Equity Opp FoF(G)
FoFs (Overseas)  |   Very High |  44.74   +-0.05  
17/5/2010 ₹ 1,676.93 -6.15% 11.83% 1.81% 9.51%